Consolidated Financial Position
(Millions of yen)
| (As of March 31) | 2012 | 2013 | 2014 | 2015 | 2016 |
|---|---|---|---|---|---|
| Current Assets | 141,070 | 138,421 | 153,572 | 171,511 | 165,780 |
| Cash and Deposits | 21,471 | 23,958 | 27,288 | 38,777 | 21,806 |
| Notes & Account Receivables | 105,642 | 101,520 | 111,194 | 114,476 | 127,364 |
| Fixed Assets | 168,413 | 173,577 | 189,849 | 203,672 | 205,463 |
| Tangible Fixed Assets | 121,258 | 126,633 | 134,398 | 143,949 | 148,227 |
| Intangible Fixed Assets | 8,498 | 8,462 | 15,244 | 14,533 | 13,833 |
| Investment and Others | 38,656 | 38,481 | 40,207 | 45,189 | 43,401 |
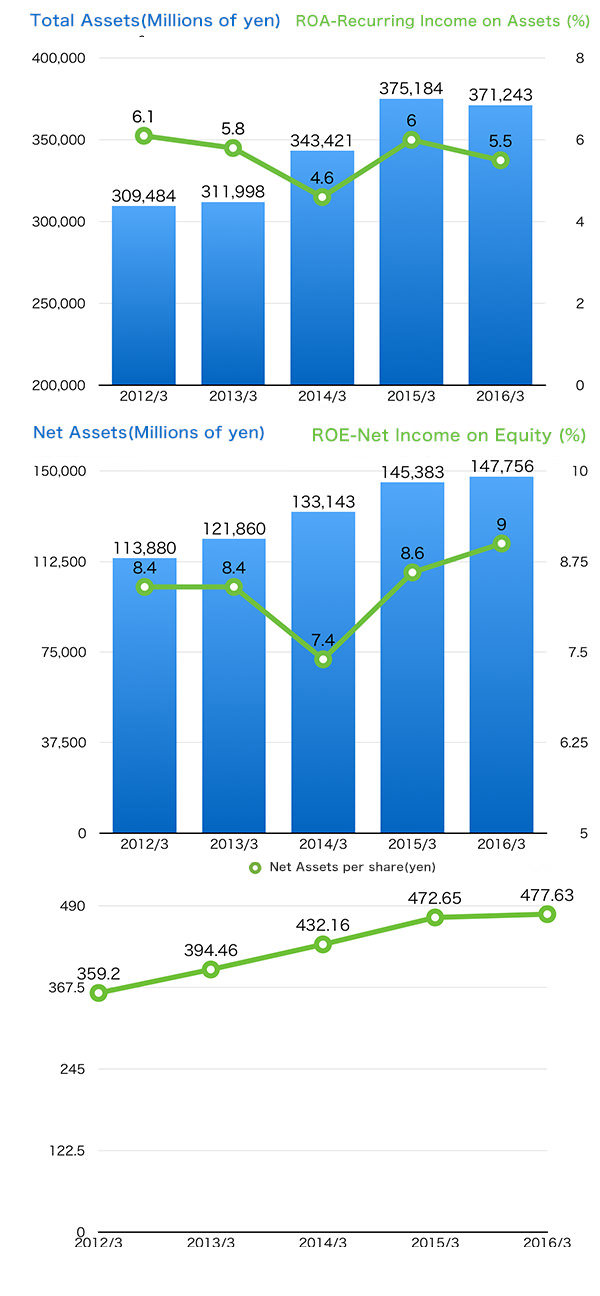
| Total Assets | 309,484 | 311,998 | 343,421 | 375,184 | 371,243 |
| Current Liabilities | 121,551 | 117,956 | 125,234 | 142,853 | 123,580 |
| Fixed Liabilities | 74,051 | 72,181 | 85,043 | 86,947 | 99,906 |
| Interest-Bearing Debt | 62,590 | 65,450 | 77,838 | 69,417 | 76,050 |
| Net Assets | 113,880 | 121,860 | 133,143 | 145,383 | 147,756 |
| Shareholders' Equity | 111,491 | 118,795 | 130,122 | 142,282 | 144,543 |
| Minority Interests | 2,388 | 3,064 | 3,020 | 3,100 | 3,212 |